| Home |
| Top Ranked |
| Places Map |
| Real Estate |
| Compare Places |
| My Great Place |
| Places Data |
| State Data |
 |

|
GreatPlacesToRetire |
|
|
Park City, Utah is one of the great places in the U.S. to live or retire. Find city facts on home sales prices, air quality, water quality, medical care, cost of living, taxes, weather and other demographics. | |
|
The interactive map below provides a birds-eye view of the city. See how home prices are trending over the past few years. Read a city profile and search homes for sale. Links in the data below provide a list of cities similar to Park City in that particular data category. Check back often for home price updates. 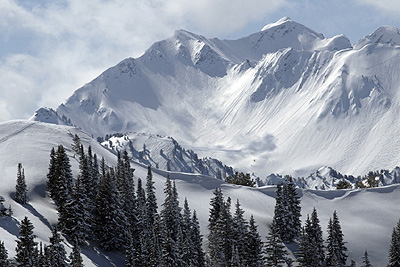
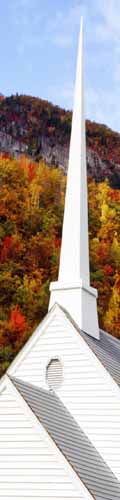
Wasatch Mountains outside Park City, Utah | See more photos!
© iStockPhoto.com/yoshimedia 
|

| Park City Population | ||||
| . | 1990 | 2000 | 2010 | 2016 (est.) |
| Summit County | blank | blank | blank | 40,307 |
| Park City | 4,468 | 7,371 | 7,558 | 8,299 |
| Park City Home Sales Prices (new & existing homes) |
||||
| . | Monthly Average | Annual Average | Yr-Over-Yr Change | |
| 2018 | . | $787,659 | 6.2% | |
| Jan | $787,659 | . | . | |
| 2017 | . | $741,717 | 0.0% | |
| 2016 | . | $741,354 | 14.4% | |
| 2015 | . | $648,258 | 9.8% | |
| 2014 | . | $590,662 | -0.2% | |
| 2013 | . | $592,006 | 8.5% | |
| 2012 | . | $545,879 | 3.3% | |
| Home Sales Price to Big City Comparison (2018) |
||
| . | Park City | GPTR 99 City Avg |
| Home Price | $787,659 | $419,000 |
| Nearest Big City | Salt Lake City | na |
| Home Sales Price in Salt Lake City | $322,000 | $340,000 |
| Home Sales Price Bargain Index | 198% of Salt Lake City home prices | 101% |
| Home Sales Price to Renting Comparison (2018) |
||
| . | Park City | GPTR 99 City Avg |
| Home Price | $787,659 | $419,000 |
| Monthly Rent | $1,712 | $1,495 |
| Price/Rent Index | 30.9 times the annual rent | 19.0 |
| Park City Cost of Living (2018) |
|
| 149% | GPTR 99 City Average 109% |
| Park City Taxes (2018) |
|||||
| blank | Tax Rate | Days Worked to Pay | State Rank | Tax Rate (99 City Avg) |
Days Worked to Pay (99 City Avg) |
| State and Local Sales Tax | 6.8% | -- | 22* | 6.8% | -- |
| Federal, State and Local Tax | -- | 101 days | 15* | -- | 113 days |
| * State rank of 1 pays the lowest taxes | |||||
| Park City Building Permits (single family homes) |
||
| 2016 | 51 | |
| 2015 | 57 | |
| 2014 | 56 | |
| 2013 | 40 | |
| 2012 | 29 | |
| 2011 | 15 | |
| 2010 | 20 | |
| You also might like: | |||
 |  |  |  |
| Boone has Similar Geography & Climate | Top Ranked Retirement Cities | Compare the Top Ranked Retirement Cities | See more photos for Park City |
 | Terms & Privacy | Site Map | About Us | Sources | Links | Advertise | Revised: 12/13/2018 Copyright © 2019 Great Places To Retire |